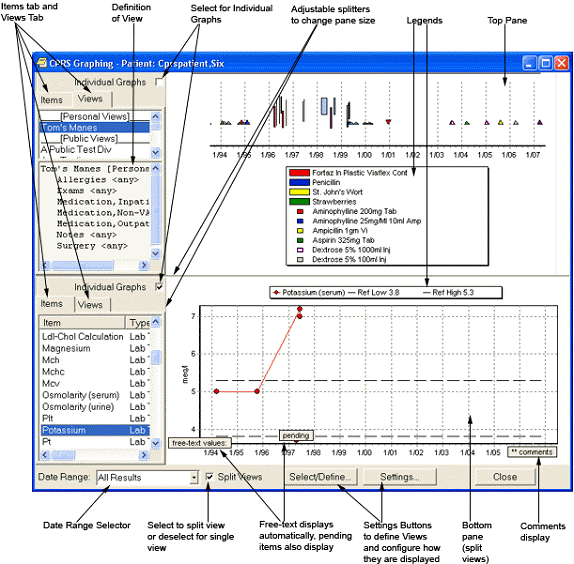
CPRS displays its graphing functionality as a detached window or a group of panes embedded within the Reports tab. (CPRS supports one detached instance of the graphing window and one Reports-tab instance per session.)You can resize and move the detached window, which enables you to set up graphs as a reference that you can view as you navigate your patient's chart in CPRS.
You can start CPRS graphing in any of the following four ways:
· From any tab: click Tools on the main menu and then click Graphing. CPRS displays the detached graphing window.
· From any tab: simultaneously press the <Ctrl> and <G> keys. CPRS displays the detached graphing window.
· On the Reports tab: click Graphing (local only) under Available Reports. CPRS displays embedded graphing panes.
· On the Labs tab: click Graph under Lab Results. CPRS displays the detached graphing window.
· On the Labs tab: click Most Recent under Lab Results and then click on any test displaying lab results.
You can then display graphs by clicking items in the View or Item lists (located in the graphing window's left-hand pane).

The Graphing Window is a stand alone window where users can review data and configure their graphing. It has many options for view data. Users should use the Setting button to configure the windows display and Select/Define... to create personal or shared views.
Related topics
Graphing Items from the Main Window
Graphing Items from the Select Items and Define Views Dialog Box
Graphing: Adjusting the Display
Graphing: Displayed Details for Graphed Items
Graphing: Using the Zoom Feature