_______________________________________________________________________________________________
CPRS includes graphing functionality that enables you to create visual representations of relationships between many types of patient data. Specifically, CPRS graphing supports data from the following indexed sources:
|
· Admissions |
· Lab tests |
· Patient education |
· Surgery |
|
· Allergies |
· Medication * |
· Problems |
· Visits |
|
· Anatomic pathology |
· Medicine |
· Procedures |
· Vitals |
|
· Blood bank |
· Mental health |
· Purpose of visit |
|
|
· Exams |
· Microbiology |
· Radiology exams |
|
|
· Health factors |
· Notes |
· Registration ** |
|
|
· Immunizations |
· Orders |
· Skin tests |
|
|
|
|
|
|
|
* Includes BCMA, inpatient, non-VA, and outpatient |
|
** Includes Dx and Op/Proc |
|
|
What You See and What You Get
CPRS graphing uses different representations for different types of items. Following is a brief discussion of selected items and their corresponding representations.
|
_______________________________________________________________________________________________ |
|
Admissions and Visits: |
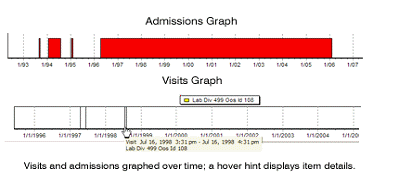
CPRS graphing displays visits and admissions on the horizontal (date/time) axis as lines or bars that indicate the duration of the visits and admissions. Bars representing hospital admissions begin at the date and time of admission and end at the date and time of discharge. Visit representations begin at the appointment date and time and end at the date and time of the visit's end. Because visit durations are often short, visit representations are typically vertical lines, rather than bars. When visit durations are unavailable, CPRS graphing uses its default duration of one hour.
|
|
|
|
|
|
_______________________________________________________________________________________________ |
|
Events: |
CPRS graphing displays as single events all items that are not laboratory tests, vitals measurements, medications (inpatient, non-VA, or outpatient), or visits. Like representations for admissions and visits, representations for single events use only the horizontal axis. CPRS graphing uses triangle-shaped representations to mark these items. (Color, shape, and height differentiate item markers.) It graphs administration times for BCMA medications as events. |
|
|
|
|
|
|
_______________________________________________________________________________________________ |
|
Medications: |
As it does with admissions and visits, CPRS graphing displays medications as bars that indicate a period of time. In the case of outpatient medications, bars begin on the horizontal axis at the release date of the medications. End dates are based on the following calculation: medication release date + number of days supply = end date. For inpatient and non-VA medications, bars begin at medication start times and dates and end at medication stop times and dates. In the case of non-VA medications, if no stop date exists, CPRS graphing uses the current date as the stop date. CPRS graphing differentiates multiple medications by color and vertically offsets them to ensure the visibility of overlapping bars. Important: Healthcare professionals have no reliable way to determine whether patients do or do not take their outpatient medications. Use caution when graphing relationships between outpatient medications and other items. |
|
|
|
|
|
|
|
_______________________________________________________________________________________________ |
|
Vitals: |
CPRS graphing displays vitals measurements as points on two axes. If more than one measurement exists for a given date and time, CPRS graphing connects measurements for like items with a line. |
|
|
|
|
_______________________________________________________________________________________________ |
|
Labs: |
CPRS graphing also displays as points on two axes laboratory tests that have results with numerical values. Lines connect like items. CPRS graphing displays lab tests with non-numerical results (positive and negative results, for example) as points on the horizontal axis. It does not connect like items that have non-numerical results. To keep them out of the way of numerical data, CPRS graphing displays non-numerical results above or below the numerical values and line. Values beginning with > are located at the top margin; others are graphed at the bottom margin. Free-text values display by default as do comments. To hide or show free-text values, click on the "free-text values:" label. Comments are displayed in yellow boxes on the date axis, while the **comments label shows that there are comments. Clicking this label will show details of all items on the graph. CPRS graphing includes reference ranges in graphs of laboratory test results. Reference ranges are displayed as dashed horizontal lines. A lab test from different specimens or having different reference ranges will display in separate graphs with the appropriate reference range. If the Merge Labs setting is used then the lab tests will be graphed as a single test (with a warning that different reference ranges are present). |
Related Topics
Graphing Items from the Main Window
Graphing Items from the Select Items and Define Views Dialog Box
Graphing: Adjusting the Display
Graphing: Displayed Details for Graphed Items
Graphing: Using the Zoom Feature